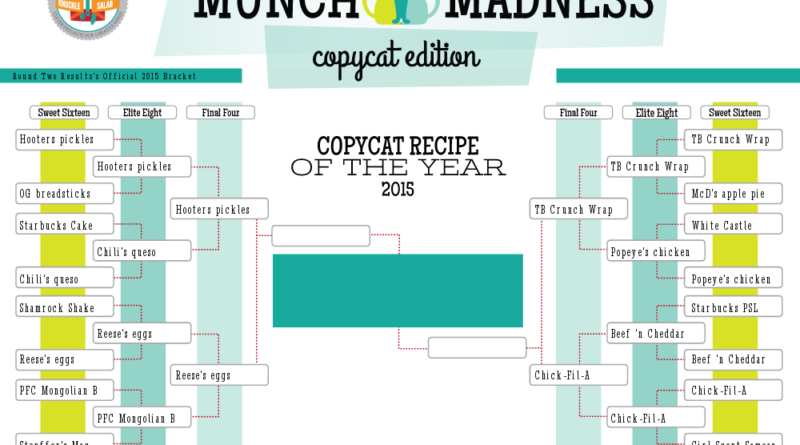
Munch Madness 2015: Breaking Down the Final Four
![]()
There are a lot of things to take into account when comparing disparate recipes like the Final Four. We’re not exactly comparing the four recipes to each other, so much as comparing the difference between each recipe and its counterpart to the difference between the other recipes and their respective counterparts. That’s tough. And we’re not just comparing them based on one measurable metric, either, but on taste, quality, similarity to the original, cost, convenience, and so on.
However, one of the biggest factors that seem to drive our interest in copycat recipes is that it’s just better for you to eat home-cooked food. Or at least, it should be.
To help us put that theory to the test, I have enlisted the expert help of Donna Ackerman, a dietetic technician who is also coincidentally my mom. I’ve asked her to break down the nutritional content of each copycat recipe, compare it with the published stats for its commercial counterpart, and give us a thoughtful assessment of just how much healthier the copycat really is (or isn’t). Hopefully, this will give us a better handle on how to compare the “healthiness” aspect of each of these recipes, while giving us an excuse to gawk at some truly ludicrous sodium counts.
Check out her analysis of each recipe below. Does any of this impact your vote? Let us know in the comments!
[divider]
Taco Bell Crunchwrap Supreme
“Their dish contains almost twice the carbs and 50% more sodium than the copycat dish. That makes me suspicious of Taco Bell’s methods.” At first, Donna speculated about foul play. In order to keep the fat and cholesterol down, had Taco Bell somehow compensated by pouring extra salt and sugar into their Crunchwrap? Is that why they refused to even include sugar in their nutritional breakdown?
But then she deduced the real reason: “The copycat recipe has a lot less carbohydrate but a lot more fat—especially saturated fat, which is doubled. But we don’t know how much meat they’re actually putting in there. There’s probably twice the amount of meat in the copycat version, which would explain that.” Boom. Mystery solved. So the restaurant version may appear to have an edge on fat and cholesterol, but a quick look at the carbs, salt and sugar will tell you that the make-at-home version is definitely a winner.
| Taco Bell Crunchwrap Supreme (Serving size: 1 Crunchwrap) |
Taco Bell | CopyKat Recipes |
| Calories | 540 | 545 |
| Fat (g) | 21 | 33 |
| Saturated Fat (g) | 7 | 14 |
| Cholesterol (mg) | 25 | 91 |
| Sodium (mg) | 1210 | 830 |
| Carbohydrates (g) | 71 | 38 |
| Fiber (g) | 6 | 4 |
| Sugars (g) | ? | 3 |
| Protein (g) | 16 | 26 |
Chick-fil-A Chicken Sandwich
Donna suspects that Chick-fil-A’s data leaves out the frying oil, because frying oil isn’t technically an ingredient. Otherwise, it’s hard to explain the huge jump in both fat and cholesterol between CFA’s sandwich and the copycat, when everything else is pretty similar between these two recipes. There’s also a difference in protein that favors the copycat, probably because Chick-fil-A uses a trimmed-down portion of chicken that’s smaller than the average breast you’d buy in a supermarket.
Everything else matches up pretty well, but like Taco Bell, Chick-fil-A has chosen not to divulge the dish’s sugar content. What are they hiding?
| Chick-Fil-A Chicken Sandwich (Serving size: 1 sandwich, buttered bun and all) |
Chick-fil-A | Hilah Cooking |
| Calories | 440 | 653 |
| Fat (g) | 18 | 32 |
| Saturated Fat (g) | ? | 14 |
| Cholesterol (mg) | 55 | 214 |
| Sodium (mg) | 1390 | 1398 |
| Carbohydrates (g) | 41 | 40 |
| Fiber (g) | 2 | 1 |
| Sugars (g) | ? | 9 |
| Protein (g) | 28 | 38 |
Hooters Fried Pickles
I don’t think of Hooters as a particularly clandestine operation, but it doesn’t publish nutritional information, so this is the only recipe for which Donna had to defer to the Internet. And although several nutrition-tracking websites agree on the makeup of the dish, we have to expect a certain amount of error.
For one thing, Donna pointed out that this data claims only 350 milligrams of sodium for half a plate of Hooter’s pickles, which is certainly incorrect. Even if there’s no salt at all in the batter (doubtful), these fried pickles are still made of pickles. Now, admittedly, we don’t know how to account for the potential variation in size between Paul’s Mt. Olive pickles and the average Hooters specimen. But Hooters pickles would have to be paper-thin, because typically, pickles alone in that quantity—virgin, unbattered, unfried pickles—contain over 550 milligrams of sodium.
“Intead of 350, I think it’s more likely that the Hooters recipe has something like 1,350 milligrams of sodium,” Donna says. Perhaps an errant keystroke (and a bunch of nutrition websites ripping off each others’ content) could be to blame for that weird statistic.
Even so, the copycat recipe is actually exceptionally high in sodium, probably because there are two teaspoons of salt added to the batter. For reference, most people’s maximum daily value of salt is less than one teaspoon. So even though Donna calculated the ingredients of this recipe as if it were supposed to serve six (Paul only made one serving, but he had so much batter left over that he considered making hush puppies!), that’s 1/3 of your entire daily sodium intake just in the batter. The batter you’re putting on a plate of pickles.
Donna caught one other red flag from this data. “The calories are comparable, but the copycat has half the fat.” Likewise, the Hooters recipe seems to have a much lower carb count, and the reason isn’t apparent. “Something is missing here…like the truth.”
Bottom line, the copycat version probably does have slightly more calories and carbs and potentially some more sodium, but we’re not buying the low-salt pickle miracle. What’s next, Hooters? Turning water into watery, watery beer?
| Hooters Fried Pickles (Serving size: about 25 pickles) |
Hooters | Budget Savvy Diva |
| Calories | 150 | 168 |
| Fat (g) | 10 | 5 |
| Saturated Fat (g) | ? | 1 |
| Cholesterol (mg) | ? | 8 |
| Sodium (mg) | 350 | 1580 |
| Carbohydrates (g) | 15 | 28 |
| Fiber (g) | 1 | 0 |
| Protein (g) | 0 | 4 |
Reese’s Peanut Butter Eggs
Reese’s doesn’t publish its nutritional information online either, but fortunately the government requires that they disclose it somewhere, and we managed to get our hands on a copy.
For the sake of the numbers, Donna has normalized this recipe for the exact weight of the original confection. That means we’re treating a serving size as though the copycat recipe had made 17 eggs, because that’s how many it would make if the eggs turned out the exact same size as the Reese’s originals. That being said, John’s peanut butter eggs were larger than their Reese’s counterparts. Instead of 17 Reese’s-sized eggs, John made 13 John-sized eggs, so his serving size would’ve been about 30% larger. (160% larger if you consider how hard it was to stop at just one egg.) But we’re gonna pretend that doesn’t matter—even though the recipe itself actually says it only makes ten. TEN. Basically, they’re Reese’s Peanut Butter Ostrich Eggs. (Are those a thing? Can they be a thing?)
There’s nothing very dramatic in this comparison, except the sodium. We went back and double-checked all of John’s ingredients to make sure there hadn’t been some mistake, but no, the commercial Reese’s egg really does have nearly 1,000% as much sodium as the much-tastier DIY version. “That must all be coming from preservatives,” Donna suggests. “The candies probably last longer than the wrappers.”
So how does this one stack up? “Apart from the sodium, the numbers are comparable. But there are five ingredients in the copycat recipe, and five lines of ingredients printed on the Reese’s wrapper. With the copycat, you know what you’re eating, so it’s well worth 47 extra calories.”
| Reese’s Peanut Butter Eggs (1 34g egg) | Reese’s | Cakescottage |
| Calories | 170 | 217 |
| Fat (g) | 10 | 15 |
| Saturated Fat (g) | 3 | 6 |
| Cholesterol (mg) | 0 | 7 |
| Sodium (mg) | 135 | 14 |
| Carbohydrates (g) | 18 | 16 |
| Fiber (g) | 1 | 3 |
| Sugars (g) | 16 | 12 |
| Protein (g) | 4 | 5 |